2026 Salary Guide Executive Summary
The 2026 UK sales hiring market in one page — nine sectors compared, four reward shapes, the cross-sector multiplier ladder, and the four things to take into your hiring plan.
← Industries Next: Analysis →The 2026 UK sales hiring market in one page — nine sectors compared, four reward shapes, the cross-sector multiplier ladder, and the four things to take into your hiring plan.
← Industries Next: Analysis →
The 2026 UK sales hiring market is cooler, more candidate-rich, and more disciplined on pay than at any point since 2020 — and, critically, it is not equally cool everywhere. This executive summary brings the whole 2026 UK Sales Salary Guide into one view: the nine sectors at a glance, the four reward shapes that organise UK sales pay, the cross-sector OTE-multiplier ladder, the Iran / Gulf macro split that runs through every chapter, and the four things to take into the rest of the year. Compiled May 2026 against ONS earnings data, KPMG/REC Report on Jobs, the EY ITEM Club regional outlook, CIPD/IRN pay-award forecasts, and the 315 benchmarked salary cells in the nine sector chapters.
The headline numbers are unambiguous. Vacancies have fallen for thirty consecutive months. There are 2.6 candidates for every vacancy, up from 1.9 a year earlier. Permanent placements fell in April 2026 at their fastest pace since January, and the KPMG and REC UK Report on Jobs named the conflict in Iran and rising business costs as the proximate causes. The 2026 private-sector pay award has settled near 3% — between the 2.96% forecast by CIPD/IRN and the 3.6% of the more generous budget surveys. For a hiring manager, this is the most candidate-rich market since the pandemic. For a finance director, it is the most disciplined wage-growth environment in half a decade.
Candidate-rich is not the same as candidate-easy — and that distinction is the spine of this guide. A deeper applicant pool does not make hiring easier; it moves where the difficulty sits. The work is no longer generating applications — it is screening a far larger field for the few candidates who genuinely fit, and then closing the right one before a counter-offer or a competing process takes them. At 2.6 applicants per vacancy, the proportion of those applicants who are right for a specific sales role has not risen — so a hiring manager now spends more time, not less, separating signal from volume.
Three further facts complicate the easy headline, and they run through every chapter.
The practical message for anyone hiring sales staff in 2026: a candidate-rich market is favourable, but favourable is not the same as easy. The applicant pool is deeper; the work of screening it for genuine fit and closing the right hire before a counter-offer is harder; retention is harder still; and knowing which way your sector's macro wind is blowing is the difference between a hiring budget that holds and one that gets deferred at the mid-year review.
Underneath the cooler market sit four parallel cost pressures that did not exist eighteen months ago, and they explain why employers are cautious even where demand is steady:
The first three are biting now and explain the permanent-to-temporary substitution that runs through every chapter. The fourth is a 2029 problem but a 2026 conversation — and, as the toolkit explains, it comes with a reassuring answer for candidates who raise it.
The table below is the single most-used reference in the guide. Every figure is the London & South East mid-point base salary drawn from the relevant sector chapter. London & SE is the common comparison point because it is the one cell every sector populated at High confidence. The Regional Pay Variance chapter explains in detail why that single figure understates how different these sectors feel on the ground.
| Sector | Entry / SDR | Mid IC | Senior IC | Management | Senior Leadership | Mid-IC OTE multiplier |
|---|---|---|---|---|---|---|
| Technology & SaaS | £38K | £68K | £100K | £100K | £140K | 1.91× |
| B2B / Cross-Sector & Professional Services | £31K | £48K | £66K | £95K | £160K | 1.15×–1.9× |
| Healthcare / Aesthetics / MedTech | £35K | £55K | £72K | £92K | £160K | 1.31× |
| Engineering | £35K | £56K | £70K | £85K | £135K | 1.29× |
| FMCG | £35K | £52K | £68K | £88K | £135K | 1.31× |
| Construction | £33K | £52K | £62K | £75K | £140K | 1.31× |
| Logistics & Supply Chain | £30K | £52K | £68K | £75K | £130K | 1.38× |
| Industrial & Manufacturing | £32K | £50K | £64K | £80K | £120K | 1.24× |
| Energy & Renewables | £30K | £48K | £68K | £85K | £140K | 1.42× |
Reading note. The B2B row is a cross-band central tendency — see the B2B note below — and its multiplier is shown as a range because B2B spans the ladder. The single B2B mid-point sits between three packages (transactional, consultative-compliance, professional-services) that look nothing like each other.
The nine sectors fall into three groups, and seeing the groups is more useful than reading any single row.
Technology & SaaS pays the most at every individual-contributor level and loads roughly half the package into variable pay. A London SaaS Account Executive on a 1.91× multiplier earns variable pay that roughly equals their base salary. This is a category of one — no other sector comes close to that structure.
B2B / Cross-Sector & Professional Services is the row to read with most care, because it is not one market. Its figures are a genuine cross-band central tendency, sitting between a short-cycle transactional package (modest base, high commission) and a long-cycle professional-services package (high base, discretionary bonus) that look nothing like each other. The single mid-point understates that spread by construction: at Mid IC, for instance, a transactional BDM sits around £30–35K base and a professional-services BDM at £50–80K, and the £48K in the table is the centre of a range neither of them occupies. The multiplier behaves the same way — it runs from roughly 1.15× at the professional-services end through ~1.6× transactional to ~1.9× in the consultative-compliance band. The professional-services end is also where B2B's senior pay ceilings sit: when a firm's newly-qualified lawyers earn £125–150K, its BD leadership has to be paid in the same atmosphere. For the Executive Summary the single instruction is that "B2B" is a question, not an answer — read the chapter and decide the band before using any B2B number.
The six traditional field-sales sectors — Construction, Engineering, Industrial, Energy, Logistics and FMCG — cluster tightly together at every level, separated by single-digit-thousand-pound differences, with Healthcare / Aesthetics / MedTech sitting just above that cluster. At Mid IC they span just £48K–£56K. The gap between the cheapest sector and the most expensive widens with seniority because that is exactly where sector pay-philosophy — equity, LTIPs, professional-services ceilings — does its work. At the bottom of the role tree, the National Living Wage compresses everyone together; at the top, the sectors are free to diverge, and they do.
The single most useful cross-sector idea in the guide is that UK sales reward in 2026 takes one of four distinct shapes. This matters because two sectors can show the same headline OTE multiplier and still pay people in completely different ways — and a candidate moving between shapes will scrutinise the difference closely.
One sector is the exception to the "one sector, one shape" rule: B2B is not a single shape — it spans three of the four. B2B is a sales motion, not an industry, and across its transactional, consultative-compliance and professional-services bands it runs the gamut from a high-variable structure that rivals Technology & SaaS to the most base-led structure in the guide. Where the shapes below name B2B, they name the band, not the whole sector.
Technology & SaaS, and the transactional and consultative-compliance bands of B2B. Variable pay is a large share of OTE, commission is real and often uncapped, and a top performer can earn well above target. In Tech & SaaS this is the classic ~50/50 SaaS Account Executive model. In B2B's transactional band — energy broking, telecoms, waste, merchant services — a modest base carries a real, often uncapped commission line at a multiplier around 1.6× (telecoms higher); in B2B's consultative-compliance band — the Croner / Peninsula model — the IC multiplier reaches ~1.9×, the most aggressive in that chapter, built on a guaranteed Year-1 floor. This is the reward shape most people picture when they hear "sales commission."
Engineering, Industrial & Manufacturing, Construction, Logistics, Energy, FMCG and the capital-equipment side of Healthcare / MedTech. The base is the larger part of the package; a target bonus sits on top — typically £8K–£35K depending on level, paid quarterly or twice-yearly; and in a meaningful minority of roles — around 30% of capital-equipment and specification roles — an additional uncapped commission is tied to invoiced revenue or gross margin. Multipliers land between 1.20× and 1.45×. This is the most common reward shape in the UK sales market — it covers the bulk of the field-sales economy, and most hiring managers reading this guide are designing a Shape-B plan whether they have named it that or not.
The professional-services band of B2B — consulting, legal, accountancy, agency and FM-commercial business development. The package is overwhelmingly base, with a 15–35% discretionary bonus on top that is tied to firm and practice performance rather than a personal commission line. Multipliers are the narrowest in the guide outside pure-base roles — roughly 1.06× to 1.31×. The driver is sales-cycle length: you cannot run a monthly commission plan against a 6–18-month consulting win or a 12–24-month FM contract, so the reward is delivered as salary plus a backward-looking bonus.
The pharma and Medical Science Liaison roles inside Healthcare. ABPI Code compliance means these roles cannot be paid on revenue at all — they carry a small management bonus (5–10%) and no commission. At the opposite extreme within the very same sector chapter, the aesthetics clinic-side Patient Coordinator earns commission of 5–15% of treatment revenue that can reach 80–120% of base — the most aggressive variable structure documented anywhere in the guide. Shape D is a reminder that "sector" is not always the right unit of analysis: Healthcare alone contains both the most regulated and the most aggressive reward structures in the guide.
The cross-sector OTE-multiplier ladder makes the four-shapes pattern visible at a glance. Eight sectors each resolve to a single rung; B2B does not — it spans the ladder, so it is shown as bands rather than a point.
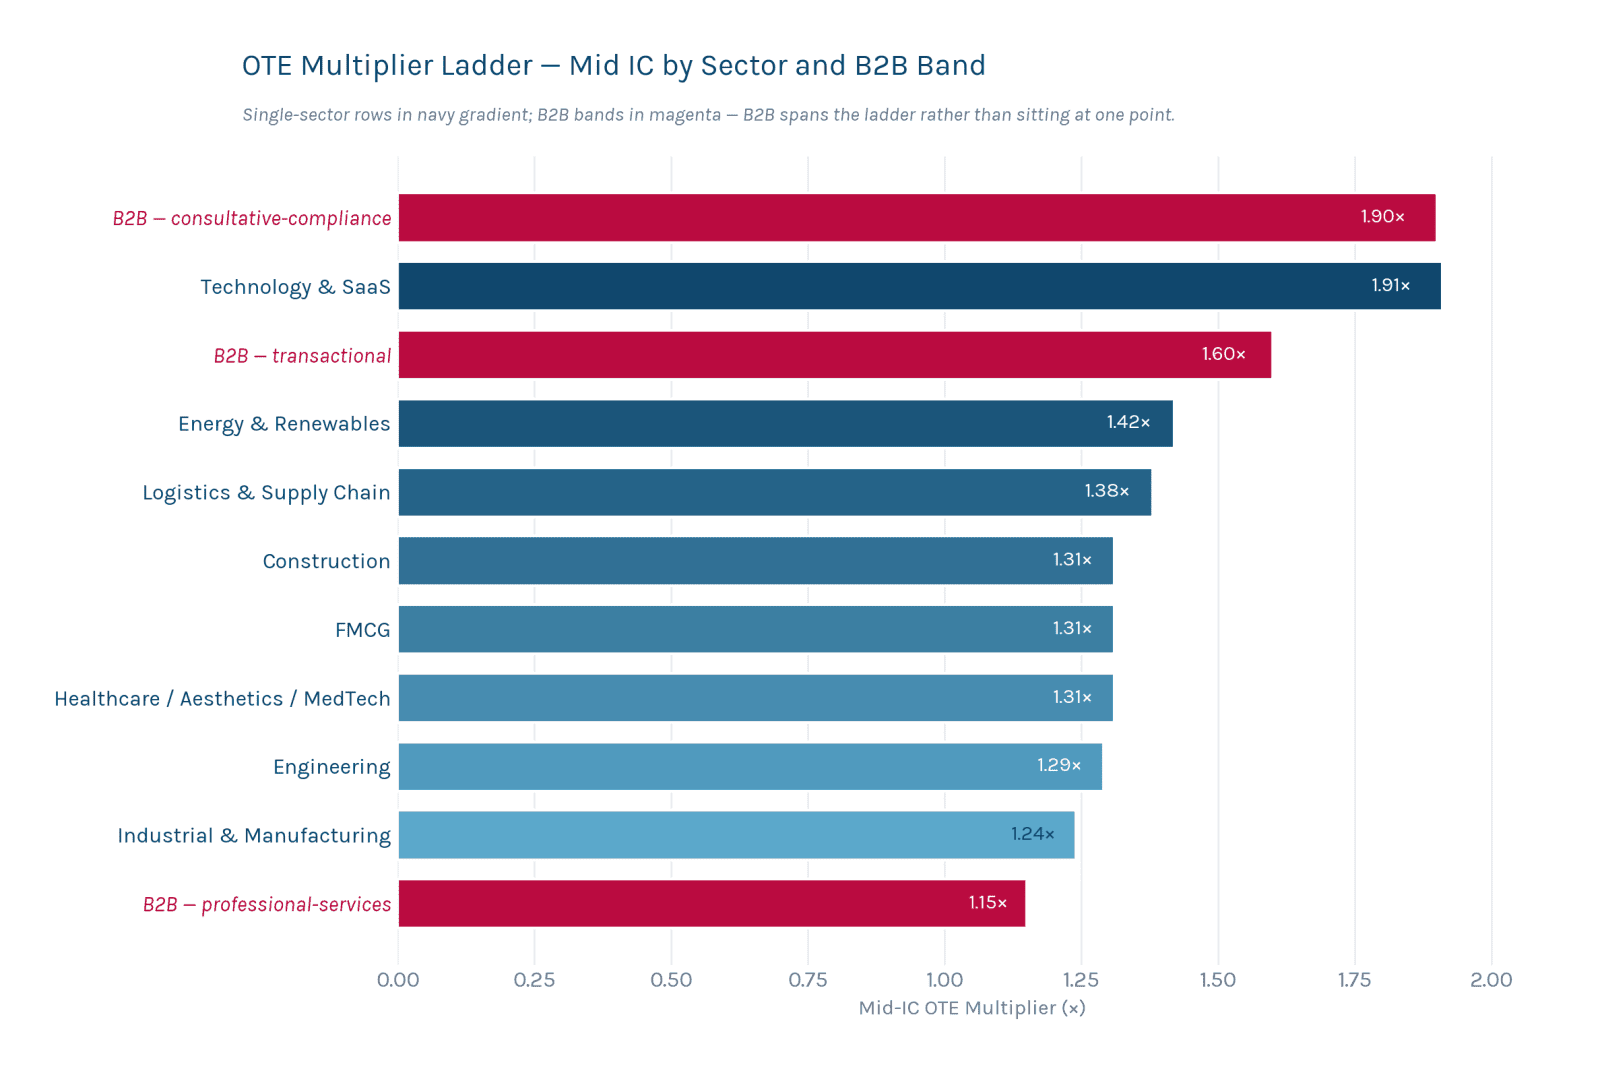
| Rank | Sector / B2B band | Mid-IC multiplier | Reward shape |
|---|---|---|---|
| — | B2B — consultative-compliance band | ~1.9× | A — true variable, guaranteed Y1 floor |
| 1 | Technology & SaaS | 1.91× | A — true variable |
| — | B2B — transactional band | ~1.6× | A — real, often uncapped commission |
| 2 | Energy & Renewables | 1.42× | B — bonus + margin commission |
| 3 | Logistics & Supply Chain | 1.38× | B — bonus + commission |
| 4= | Construction | 1.31× | B — bonus + spec commission |
| 4= | FMCG | 1.31× | B — structured target bonus |
| 4= | Healthcare / Aesthetics / MedTech | 1.31× | B/D — capital-equipment overlay |
| 7 | Engineering | 1.29× | B — bonus + capital-equipment commission |
| 8 | Industrial & Manufacturing | 1.24× | B — bonus + commission |
| 9 | B2B — professional-services band | ~1.15× | C — discretionary, base-led |
Tech sits alone at the top of the single-sector ranking; the seven Shape-B sectors in between are all running variations on the same theme and differ from one another by only a few percentage points; and B2B is the sector that cuts through the whole ladder. A hiring manager moving a candidate between, say, Logistics and Engineering is moving them between near-identical reward structures. A hiring manager moving a candidate from Tech into a professional-services B2B role — or the reverse — is changing the entire shape of how that person is paid. But a move from Tech into a transactional or consultative-compliance B2B role is a far smaller change of shape than the single word "B2B" suggests: those bands pay on real, often uncapped commission too. The lesson the ladder teaches is that "what sector?" is not a fine enough question for B2B — "which band of B2B?" is.
The conflict in Iran is the dominant macro event of the 2026 hiring market, and the guide treats it not as a single uniform headwind but as a differentiated force that the nine sectors feel in opposite directions. The triangulation:
| Direction | Sectors | Mechanism |
|---|---|---|
| Net positive | Engineering; Energy & Renewables | Defence, energy-resilience and reshoring demand; energy-security framing accelerates renewables investment and hiring |
| Insulated / mixed-neutral | B2B (professional-services band); Healthcare (aesthetics side) | Consulting and legal are counter-cyclical (restructuring, disputes, sanctions advisory); aesthetics injectables are sourced from Ireland / Switzerland / UK — advice and injectables do not travel through the Strait of Hormuz. B2B's transactional and consultative bands track the broad SME economy rather than the Gulf shock |
| Net negative | FMCG; Industrial & Manufacturing; Construction | Input-cost inflation on materials whose prices the conflict has lifted (methanol, polymers, sulfur, building materials), compressing margins and hiring budgets |
| Net negative — most exposed | Logistics & Supply Chain | Its cost base is the affected shipping lanes — Hormuz / Red Sea disruption, Asia–Europe freight rates up 25–40%, war-risk surcharges on containers |
The pattern is coherent once you see it: the conflict helps the sectors that sell resilience and hurts the sectors that move physical goods through the affected sea lanes. The EY ITEM Club's regional finding sharpens it — South Wales and the Humber forecast as the hardest-hit areas (energy-intensive manufacturing exposure), Cambridge as the only major UK city forecast to grow employment in 2026 (a knowledge economy shielded from the energy shock). That regional split maps almost exactly onto the sector split: the places that make and move things are exposed; the places that think and advise are insulated. For a hiring manager, the practical conclusion is that the 2026 macro environment is not equally hard for everyone — and knowing your sector's position on this table is a planning input, not just background colour.
If you read only the executive summary and stop here, take four things into the rest of the year:
One more use for this guide before you go any further. The reader benchmarking the roles below them is, very often, a Sales Manager, a Head of Sales or a Sales Director — and the Management and Senior Leadership rows of every sector chapter, and the senior-leadership analysis in the Cross-Cutting Analysis, are a benchmark for your own package, not only your team's. It is worth reading them with that question in mind: is your base, your bonus design and your long-term-incentive arrangement where the 2026 market would put them? If the answer is uncertain — or if the figures suggest you are behind — that is exactly the conversation Sales Recruit UK has every week.
The rest of the guide is the detail behind this executive summary. The nine sector chapters carry the 35-cell salary benchmarks for each market. The Cross-Cutting Analysis places the sectors side by side. The Regional Pay Variance chapter unpacks the London premium and the regional clusters that pay London money. The Hiring Manager Toolkit turns all of it into a working process. Sales Recruit UK recruits commercial talent across every sector and seniority level in this guide, and across the whole of the UK and Republic of Ireland. To see how we run a search, read about our process and the SRUK Fit Score. To start a conversation about a 2026 hire — or to benchmark your own package against the figures above — tell us about the role.
About this executive summary. The figures and findings here are drawn directly from the nine sector chapters and the 315 benchmarked salary cells they contain. Macro context is triangulated against KPMG/REC UK Report on Jobs (May 2026), EY ITEM Club Regional Outlook (May 2026), CIPD/IRN 2026 Private Sector Pay Survey, ONS Vacancies and Jobs in the UK, and ONS Annual Survey of Hours and Earnings. The four-reward-shapes framework and the OTE-multiplier ladder are syntheses of the nine sector chapters' bonus and commission sections. The Iran / Gulf impact table reflects the macro-impact reads in each individual sector chapter. Read the full Methodology for the source register, sample-size detail and confidence-rating conventions.